1. 타겟 변수 파악하기
## 데이터 주 관심사인 SalePrice의 분포 확인
f, ax = plt.subplots(figsize = (8, 7))
sns.distplot(train_data['SalePrice']);
ax.set(ylabel = "Frequency")
ax.set(title = "SalePrice distribution")
plt.show()
train_data['SalePrice'].describe()
2. 변수 살펴보기
- Numeric 변수
## 1. 숫자형 설명변수 살펴보기
numeric_cols = []
numeric_dtype = ['int32', 'int64']

# 숫자형 설명 변수 집합
for i in train_data.columns:
    if train_data[i].dtype in numeric_dtype:
        numeric_cols.append(i)
print('numeric variables', numeric_cols)
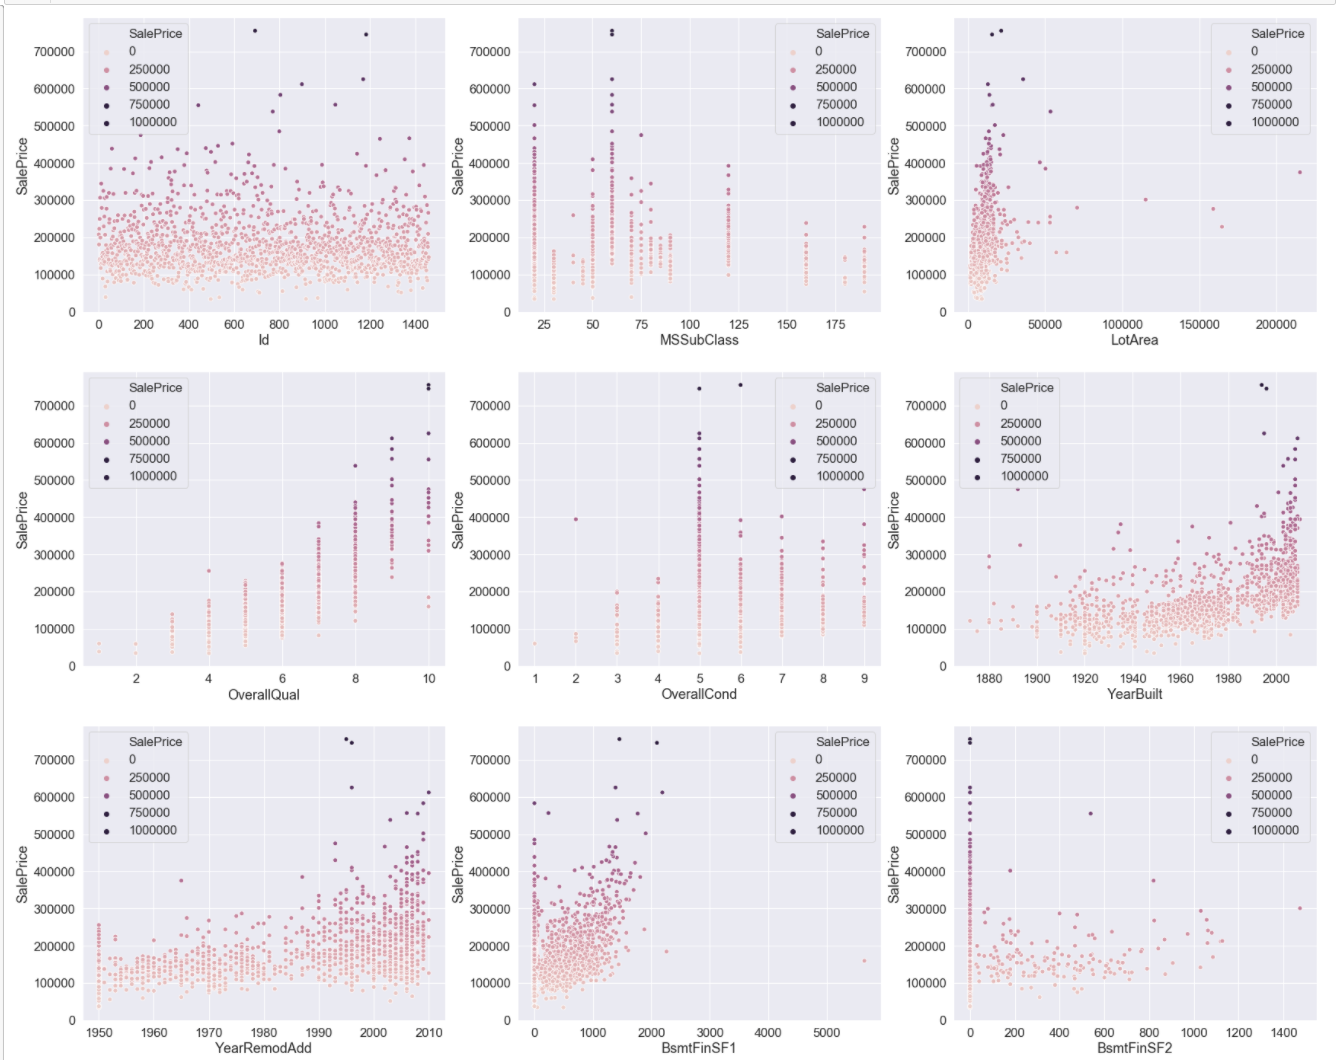
위와 같이 SalePrice와의 산점도를 통해 관련성이 있는지 확인
OverallQual, Yearbuilt, YearRemodAdd, 1stFirst, GrlivArea, FullBath, TotRmSabvgrd, GarageCars가 SalePrice와 관련성을 보임
- category 변수
## 범주형 독립 변수에 대한 분포 확인하기
category_cols = []

# 범주형 변수 집합들
for i in train_data.columns:
    if train_data[i].dtype == 'object':
        category_cols.append(i)
print('category variables', category_cols)

범주형 변수에서 관련성이 있어보이는 변수는 보이지 않았다.
'데이터 분석 > Kaggle' 카테고리의 다른 글
| House Price (5) - 모델링 & 파라미터 튜닝 (0) | 2022.01.05 |
|---|---|
| House Price (4) - 변수 선택 (0) | 2022.01.04 |
| House Price (2) - 결측치 확인 및 처리 (0) | 2021.12.21 |
| House Price (1) - 데이터 설명 (0) | 2021.12.20 |


댓글